The ONS Data That Sent us into Stricter Tiers end of Oct

1finny

Well-known member
Johnson referred to the ‘surge’ in incidences from 4.3 Per 10000 cases early October more than doubling to 9.52 per 10,000 by 17th October.
Scary Stuff

Latest data for ONS (4th Dec) shows the 17th October revised down to 4.89. It has never been above 6.62

Huge decisions being taken on flawed data (Peston is the source)

Be interested to know if Peston has this right?
 

Attachments

  • F6BD5C76-195E-40CD-8D95-A70447992DFA.jpeg
    F6BD5C76-195E-40CD-8D95-A70447992DFA.jpeg
    833.9 KB · Views: 12
Johnson referred to the ‘surge’ in incidences from 4.3 Per 10000 cases early October more than doubling to 9.52 per 10,000 by 17th October.
Scary Stuff

Latest data for ONS (4th Dec) shows the 17th October revised down to 4.89. It has never been above 6.62

Huge decisions being taken on flawed data (Peston is the source)

Be interested to know if Peston has this right?
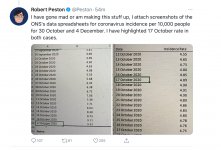
I’m not sure but buried in amongst the dozens of Facebook users saying ‘welcome to the party’ etc etc and patting themselves on the back for believing they have been right all along, is this response which has gone largely unnoticed and may provide a very simple explanation (I’ve not time to check ) -

 
Surely the fact that actual cases and deaths spiked October/November suggests the modeling trend was a useful indicator? In fact if the stricter measures had been introduced when SAGE suggested (end September) the surge could have been arrested?
 
Surely the fact that actual cases and deaths spiked October/November suggests the modeling trend was a useful indicator? In fact if the stricter measures had been introduced when SAGE suggested (end September) the surge could have been arrested?
12 October for tiers was 3 weeks too late. Many of the 20,000 who have died since may still be alive. Possibly even the father of a good friend who died this week.
 
How do we know whether that tweet is right?

True, and I can’t be chewed to try and find out😂
That’s a sad indictment of where we are now - so much contrary info and stats and changing pictures, it’s getting impossible to get a proper idea of what is going on.
 
True, and I can’t be chewed to try and find out😂
That’s a sad indictment of where we are now - so much contrary info and stats and changing pictures, it’s getting impossible to get a proper idea of what is going on.

Yup - I know where you are coming from
And - I should have known better than put the OP up.
Memo to self........
 
Last edited:
True, and I can’t be chewed to try and find out😂
That’s a sad indictment of where we are now - so much contrary info and stats and changing pictures, it’s getting impossible to get a proper idea of what is going on.
The data is available here . There was no revising down of the incidence rates at any time, as the ONS responded to Peston's tweet.
 
True, and I can’t be chewed to try and find out😂
That’s a sad indictment of where we are now - so much contrary info and stats and changing pictures, it’s getting impossible to get a proper idea of what is going on.

Unless you're one of the lockdown is effective gang at which point there's only one answer, the most apocalyptic one.
To be like this just don't drill down or interrogate any data and take it at face value. If all else fails accuse people who have other thoughts of being uncaring.
 
Another one for the curious
w.e 28th Nov ONS say circa 7.7% of 100000 had incidence of Covid
75% are in the under 35 group with the biggest group being 11 - 24
w.e 20 Nov 99% deaths over 45; 70% over 75
 
Another one for the curious
w.e 28th Nov ONS say circa 7.7% of 100000 had incidence of Covid
75% are in the under 35 group with the biggest group being 11 - 24
w.e 20 Nov 99% deaths over 45; 70% over 75

Is that 7.7 in 100,000 or 7.7% of 100,000 - bit of a difference - the former is not a lot but the latter is 7,700
 
Back
Top